

Task Response-Time Assessment Method for Coordinated Tasks in Unmanned Systems Based on Period Decomposition
-
摘要: 无人系统协同任务若未在响应时限内完成, 超时处置可能改变任务链执行路径并影响任务目标达成。因此需估计给定时限下的超限概率, 也需确定允许超限概率对应的任务响应时间; 当允许超限概率极小时, 有限样本超限观测不足, 经验估计难以稳定获得对应时间。对于含单一主导周期服务环节的任务, 跨周期等待使上述关系呈阶梯变化。为此, 提出基于周期分解的无人系统协同任务响应时间评估方法, 将任务响应时间分解为整数周期层和周期内余量, 分别采用极值理论建模, 并利用并集上界重构任务响应时间与超限概率的估计关系。采用同一水下无人系统任务结构的6种模拟配置, 以独立大样本经验曲线为参照验证。结果表明, 在允许超限概率10−4~10−6范围内, 所提方法的曲线距离中位数为1.131个周期, 低于对照方法; 在10−6时, 任务响应时间估计的相对误差中位数为6.63%。该方法不要求两个分量相互独立, 可为含周期服务环节的无人系统协同任务响应时限评估提供量化依据。Abstract: When a coordinated task in an unmanned system is not completed within its response-time limit, timeout handling may change the execution path of the task chain and hinder achievement of the mission objective. It is therefore necessary both to estimate the exceedance probability for a specified limit and to determine the task response time corresponding to an allowable exceedance probability. When the allowable probability is extremely small, finite samples contain too few exceedance observations for empirical estimation to stably determine the corresponding time. For tasks with a single identifiable dominant service period, cross-period waiting makes the relationship between task response time and exceedance probability stepwise. To address this problem, a period-decomposition method is proposed for assessing the response time of coordinated tasks in unmanned systems. It decomposes task response time into an integer period layer and a within-period remainder, models the two components separately using extreme-value theory, and uses the union bound to construct an estimate of the relationship between task response time and exceedance probability. The method is evaluated under six simulated parameter configurations of the same task structure in an unmanned underwater system against independent large-sample empirical curves. For allowable exceedance probabilities from 10−4 to 10−6, the proposed method achieves a median curve distance of 1.131 service periods, lower than those of the benchmark methods. At 10−6, the median relative error of the estimated task response time is 6.63%. The method does not require independence between the two components and provides a quantitative basis for assessing response-time limits of coordinated tasks in unmanned systems with periodic service stages.
-
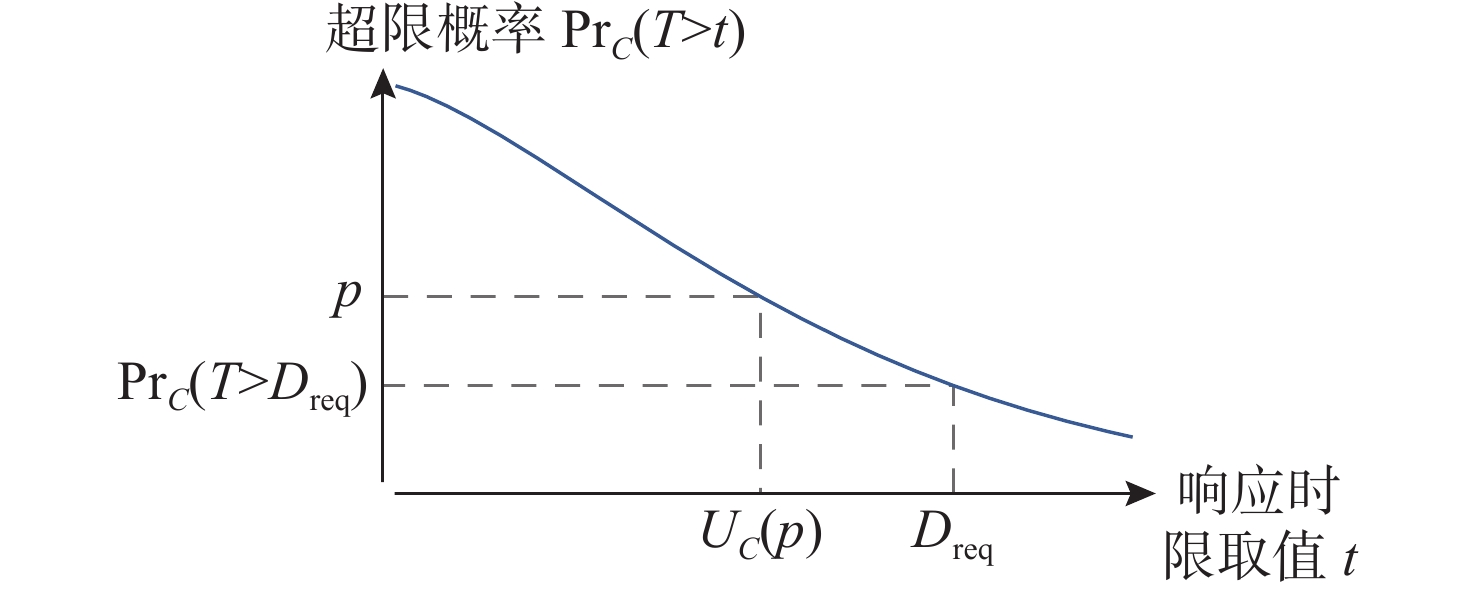
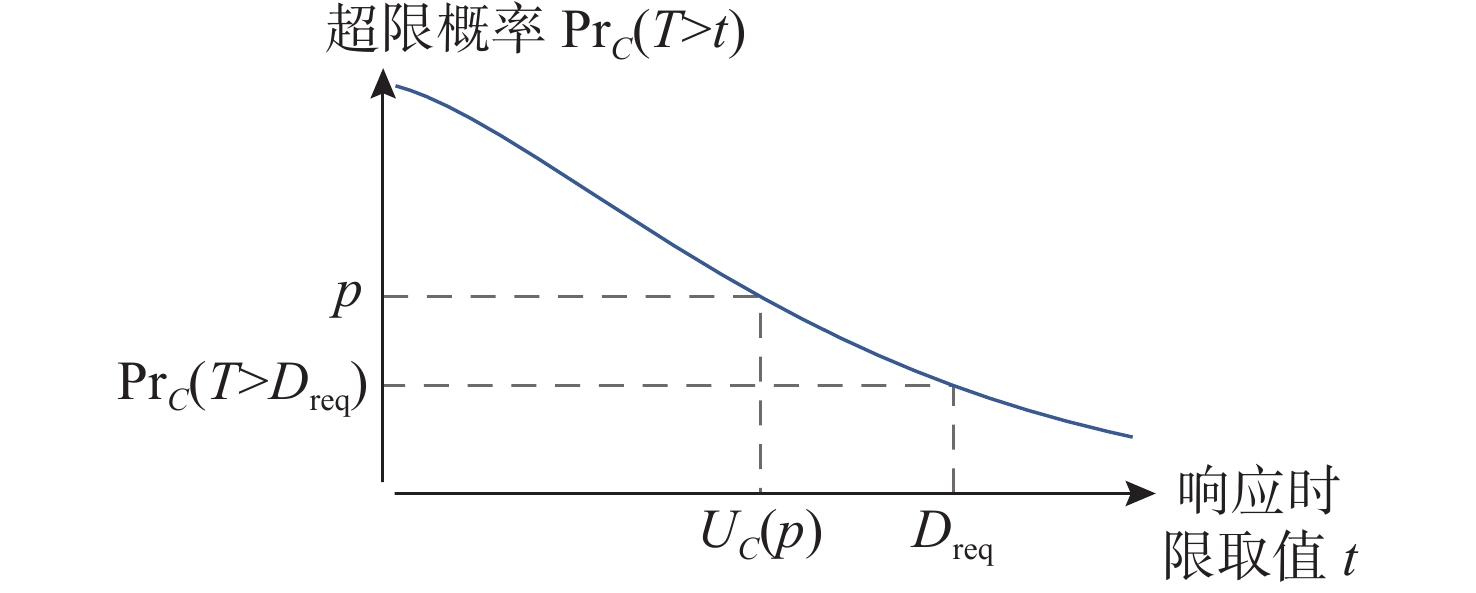
图 1 响应时限取值与超限概率的对应关系
Figure 1. Relationship between task response time limit values and exceedance probability
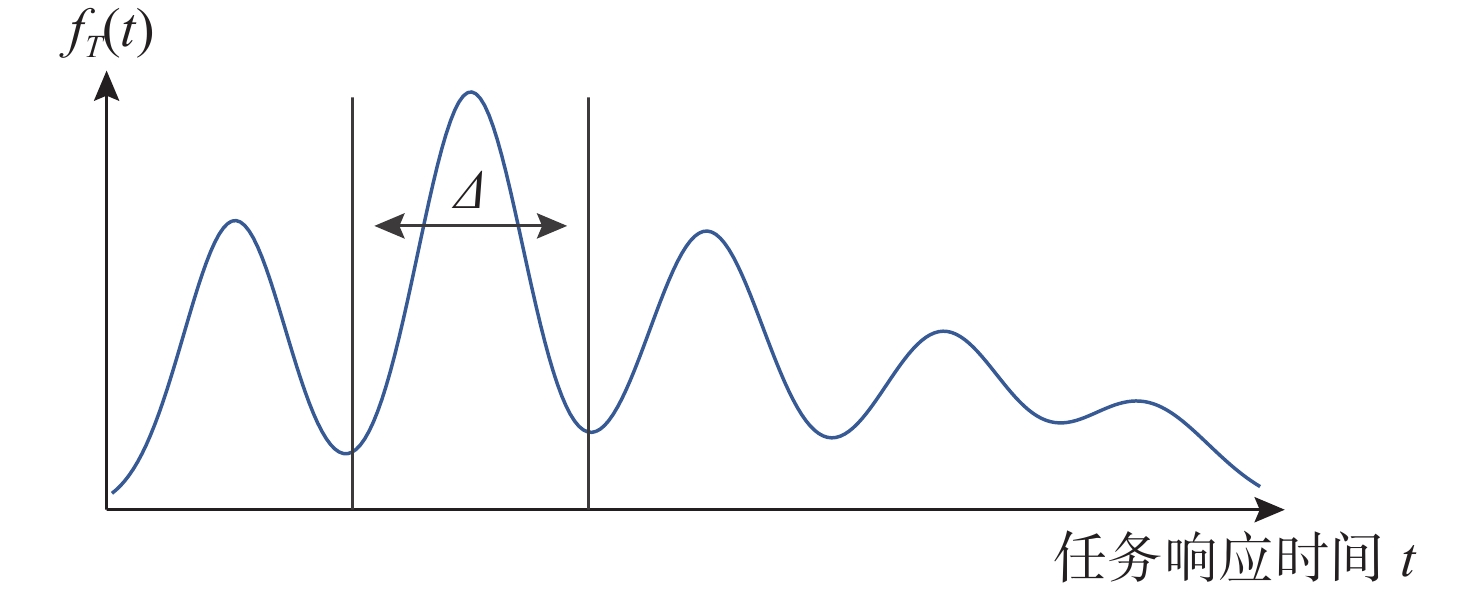
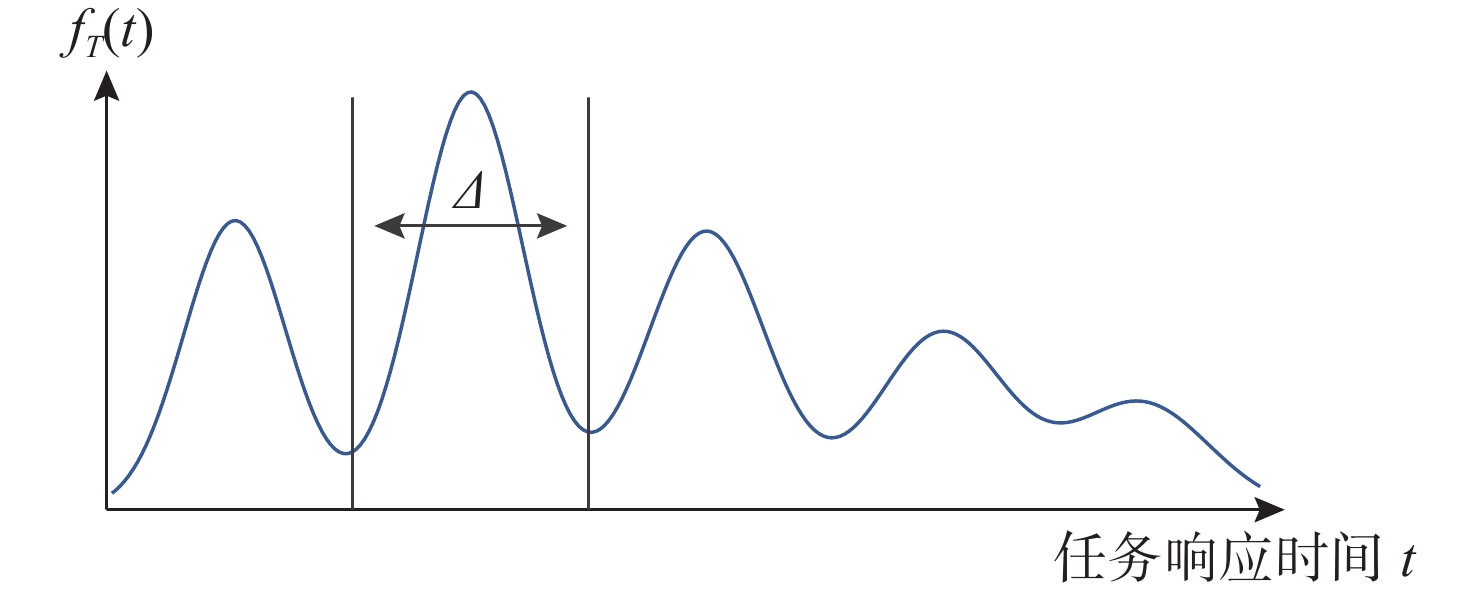
图 2 周期服务下任务响应时间的概率密度示意
Figure 2. Schematic probability density of task response time under periodic service
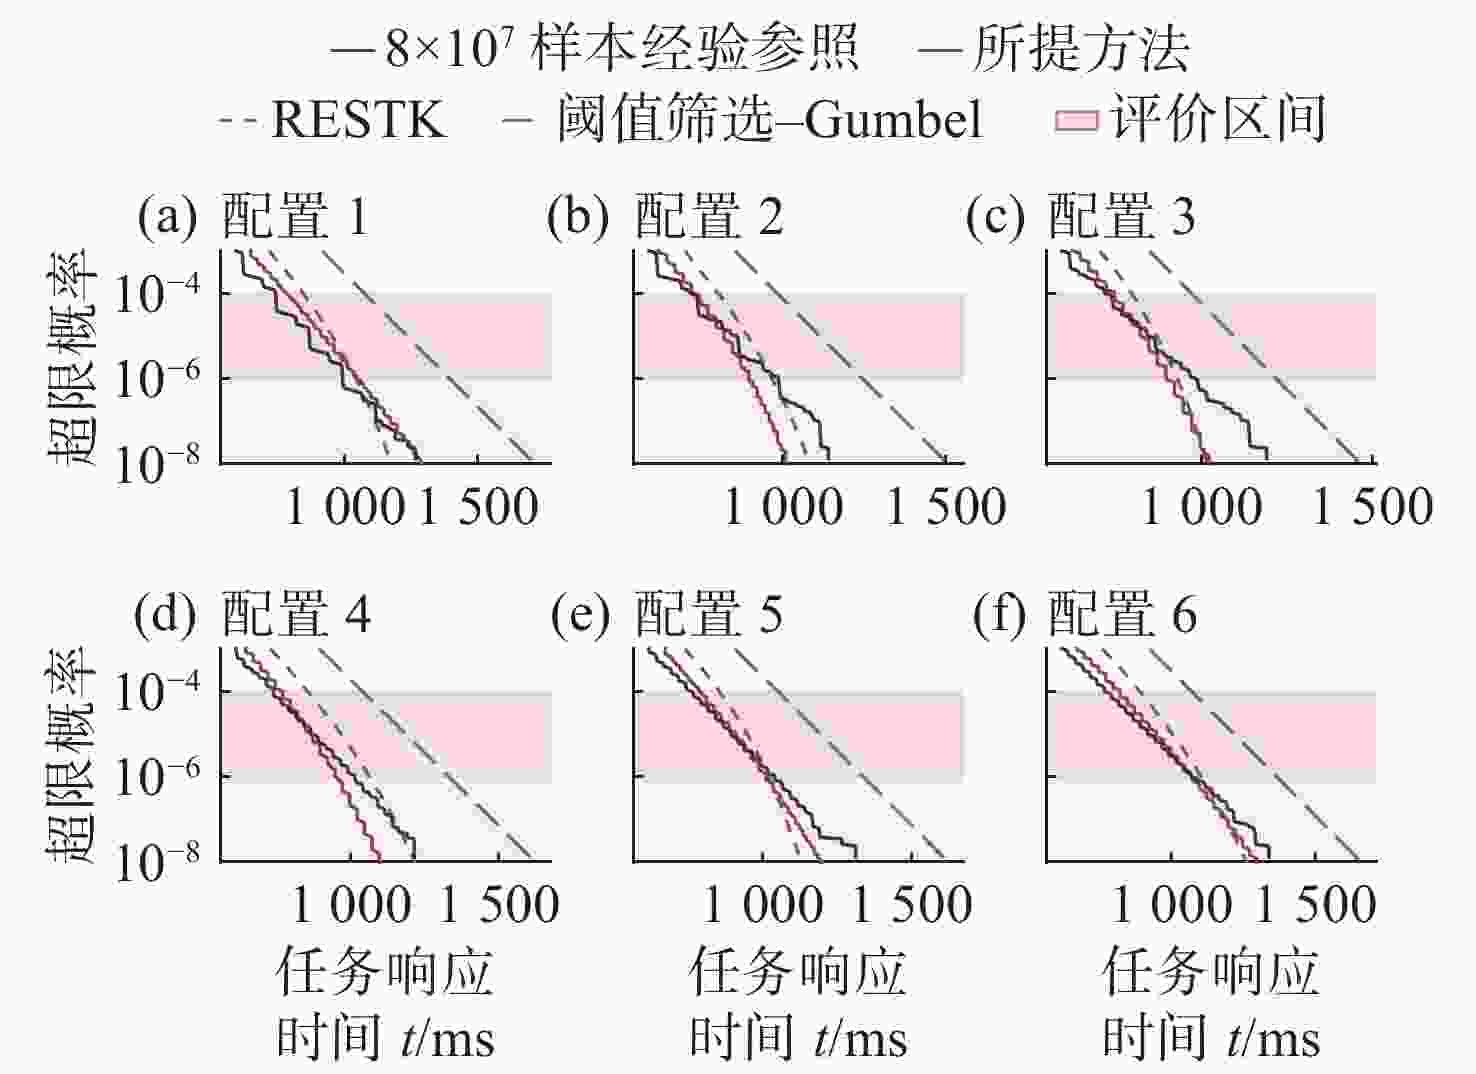
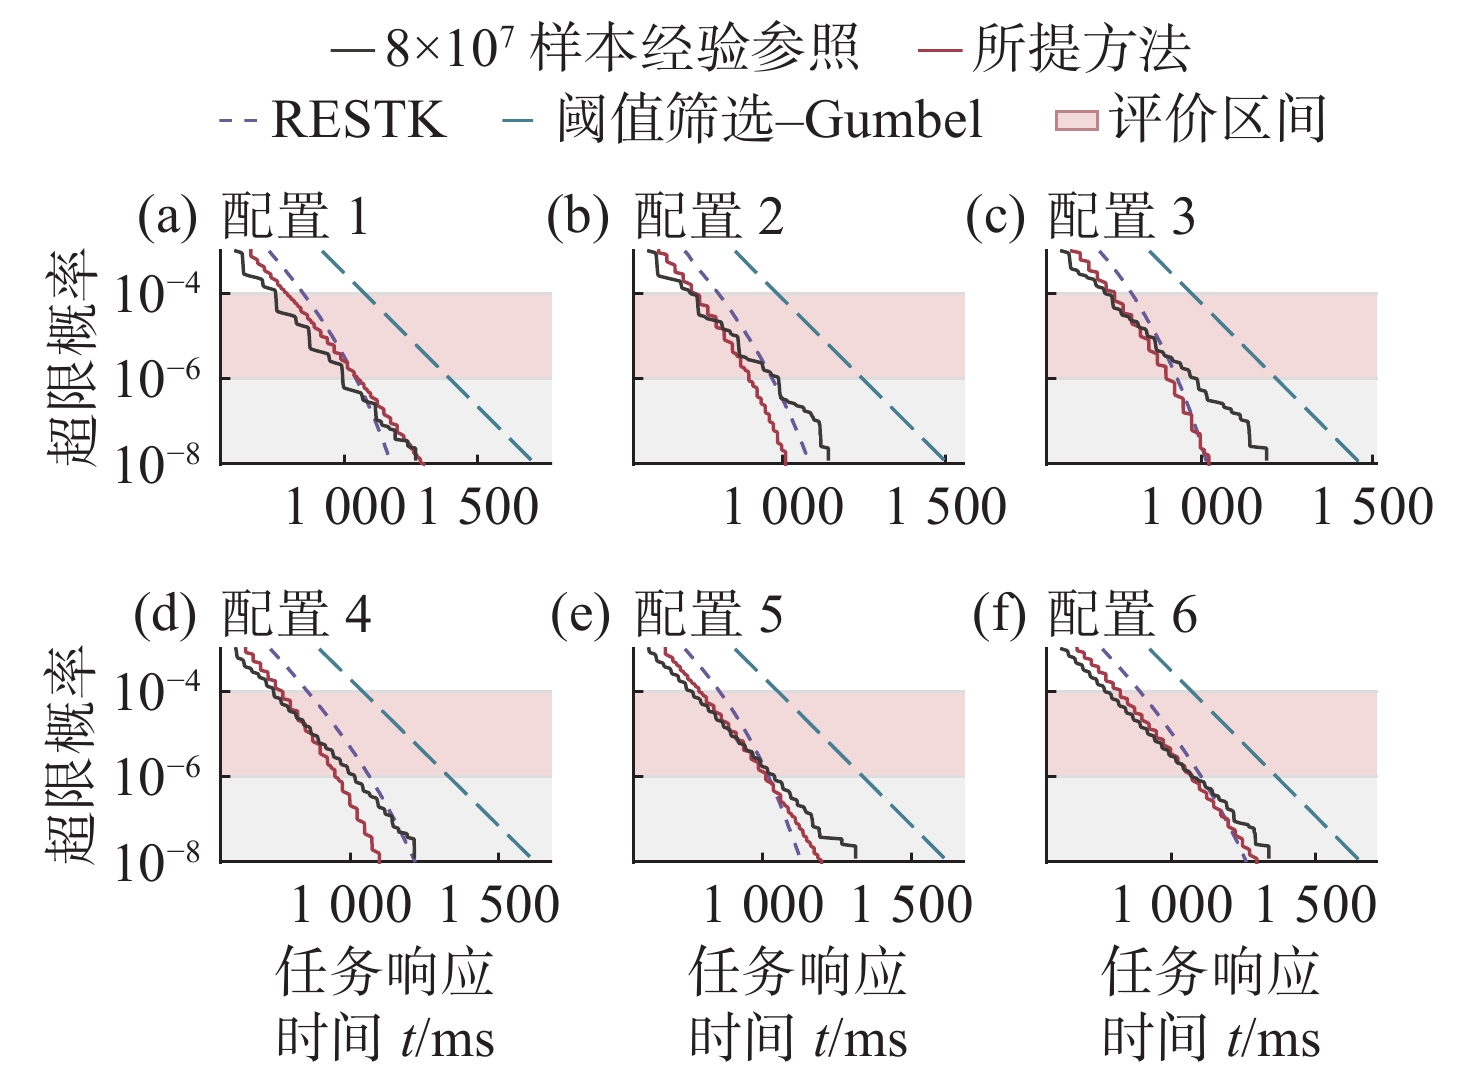
图 3 6种配置下任务响应时间与超限概率关系曲线比较
Figure 3. Comparison of task-response-time–exceedance-probability curves under six configurations
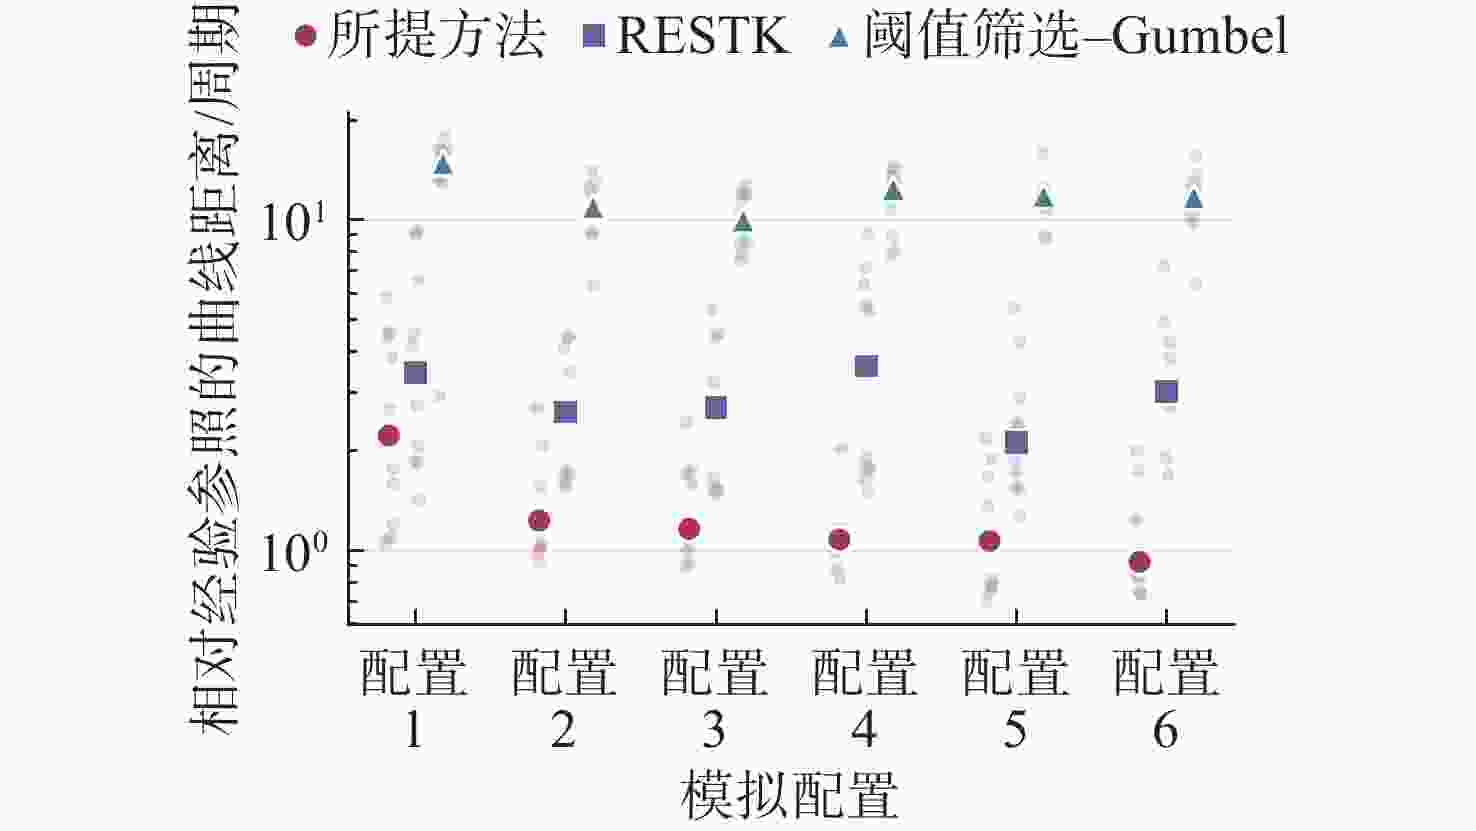
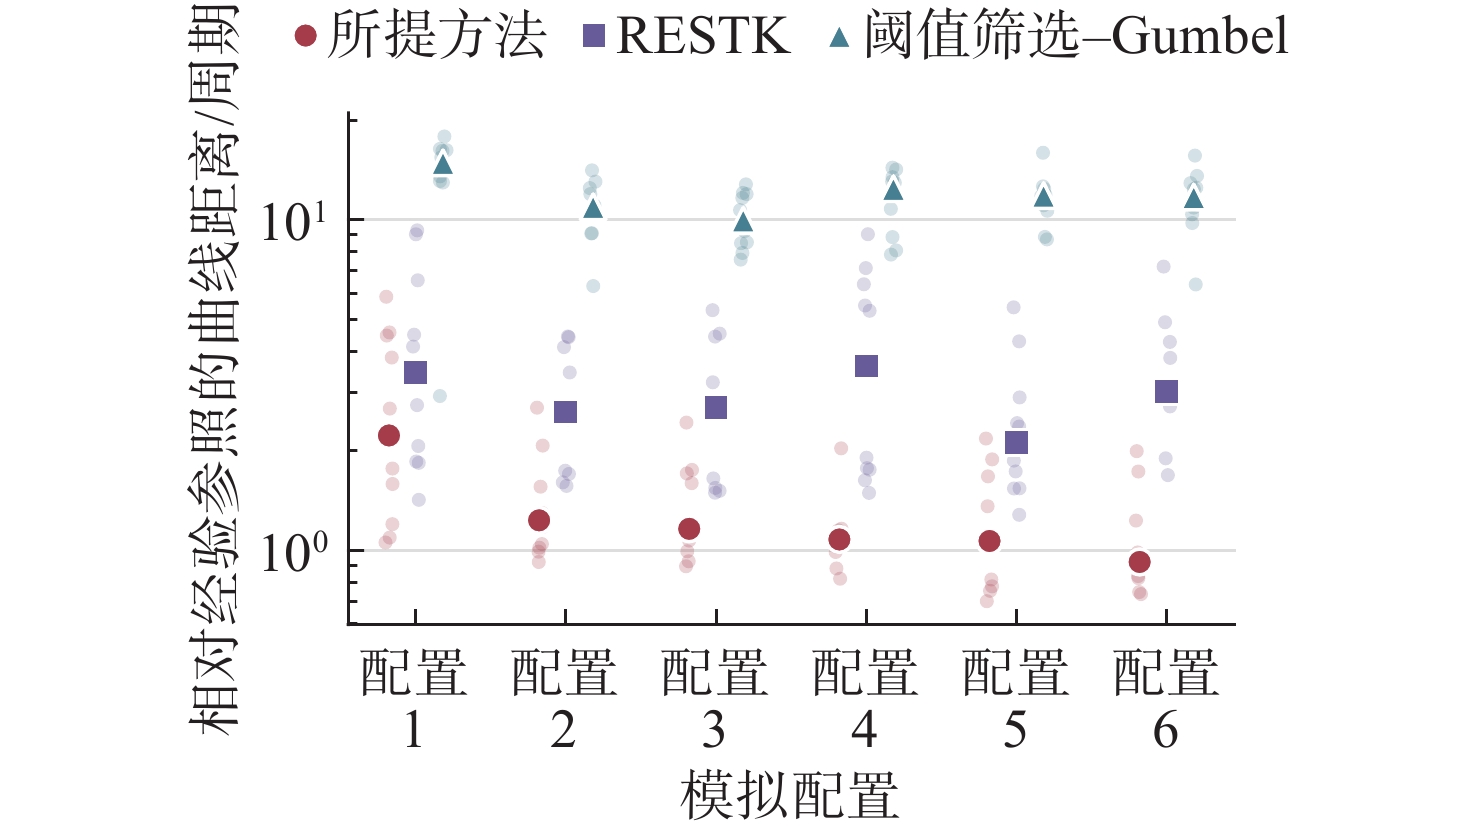
图 4 不同配置和重复样本下的曲线距离
Figure 4. Curve distances across configurations and repeated samples
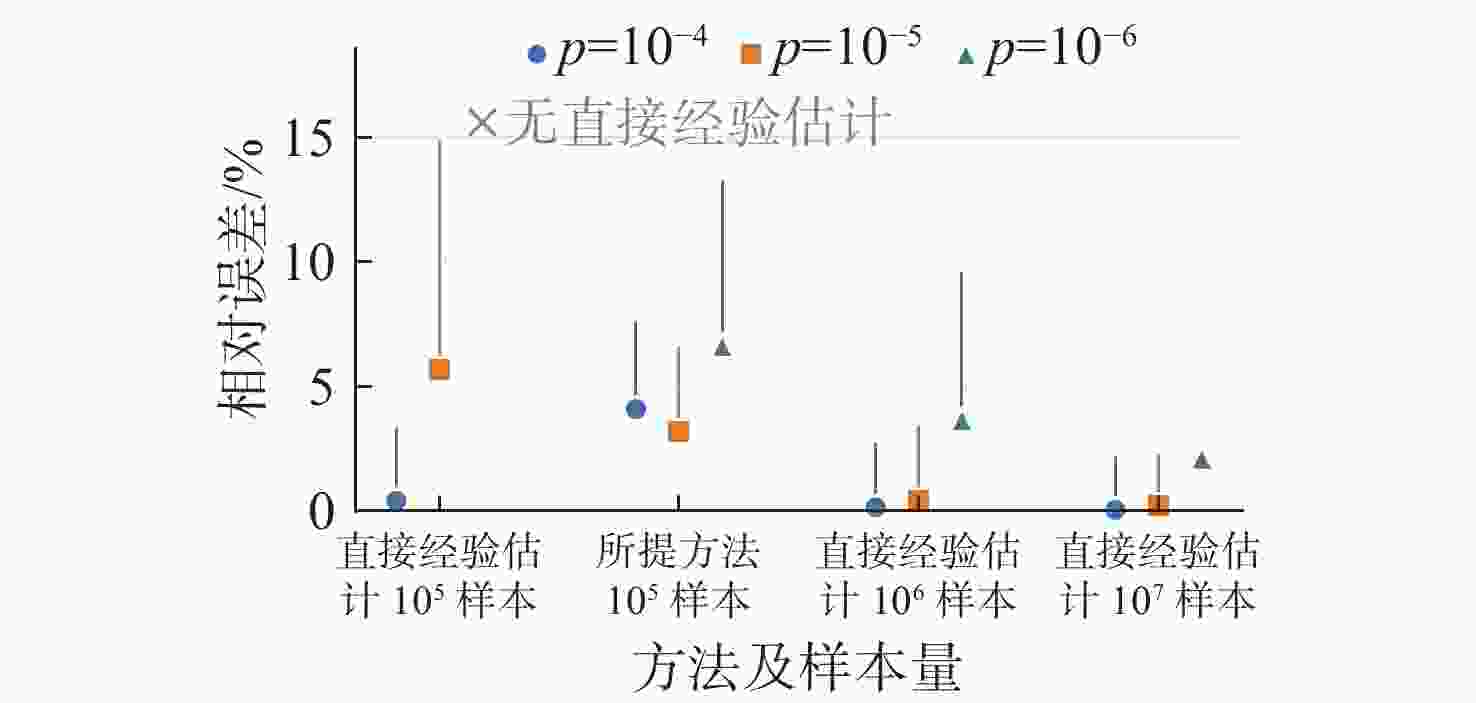
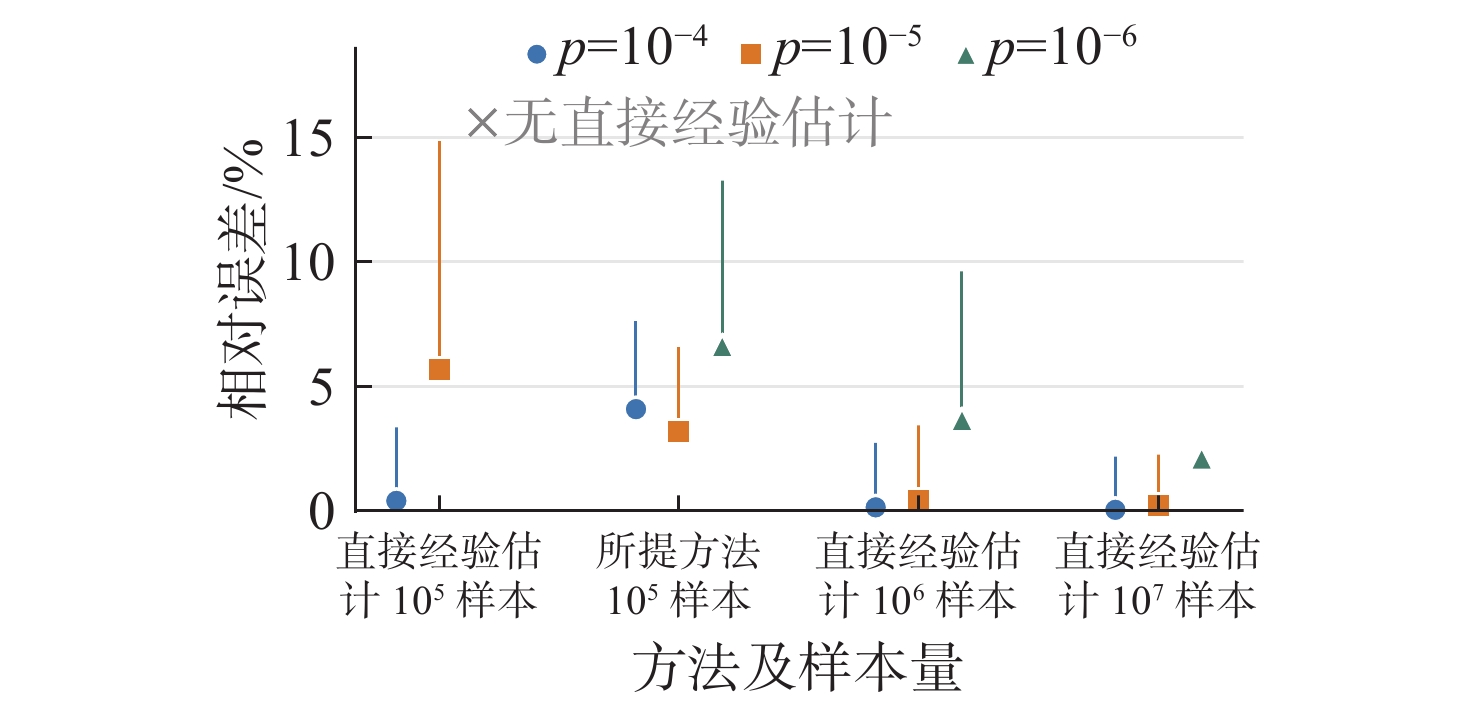
图 5 有限样本极值估计与大规模样本直接经验估计误差
Figure 5. Errors of finite-sample extreme-value estimation and large-sample empirical estimation
表 1 典型协同任务的响应时间构成
Table 1. Composition of response time for typical cooperative tasks
典型任务 发起事件 完成事件 主要环节 等待因素 导航状态更新 新传感器数据到达或
更新周期触发融合状态发布
并可供控制使用传感器、融合、控制 数据齐备、时间对齐、
融合处理控制指令执行 控制指令生成或接收 执行动作完成
并形成状态确认决策、控制、
执行、反馈调度窗口、资源占用、
状态确认载荷数据回传 数据采集或预处理完成 接收端获得规定数据或确认 载荷处理、传输、接收 链路时隙、重试、
接收确认故障处置 异常监测条件触发 隔离、切换或恢复状态成立 监测、诊断、隔离或
切换、恢复状态确认、恢复重入 协同信息交互 状态交换或协同请求发出 协同结果形成或
资源协调确认状态交换、资源协调、结果汇聚 数据同步、资源可用  下载: 导出CSV
表 2 模拟任务的完整参数与运行规则
Table 2. Complete parameters and operating rules of the simulated mission
项目 设置 任务与服务 5个端点, 每端点3次有效报告; 周期25 ms、应答窗口5 ms; 相位始于调度器自检结束; 全部应答调度完毕并完成50 ms控制处理时结束。 固定时延 同步、数据、应答及初始等待分别为1、2、2、10 ms; 总线非抢占, 同步优先, 其余消息按入队顺序服务。 上电与自检 控制上电均值15 ms; 端点1~5自检均值30、40、5、10、35 ms, 调度器15 ms; 以上时延为高斯抽样, 标准差为均值的10%, 夹持至均值±2个标准差且不小于1 ms。 6种配置上电 端点初次及恢复上电采用对数正态时延, 不小于1 ms; 配置1~6名义均值为12.5、14.0、15.5、17.0、18.5、20.0 ms, 变异系数为 0.2125 、0.2840 、0.3685 、0.4660 、0.5765 、0.7000 。报告处理 端点1~5每次收到同步后分别处理5、8、11、14、17 ms, 完成后提交数据报告。 通信与重试 传输成功概率0.99; 非同步消息在传输成功后的校验成功概率0.995。失败消息保留队首重试, 连续2次失败切换通道, 增加3 ms等待。 恢复规则 看门狗40 ms, 有效报告重置计时; 超时清零报告计数和待应答状态, 重新上电、自检并等待同步; 已入队消息保留。 随机数与终止 配置序号j取1~6, 分析与参照种子基数分别为2×10⁹+2×10⁷j和108+1.2×10⁸j; 第i次运行用基数+i, i从0起。队列、事件堆及单次事件数上限分别为32、 4096 和2×10⁵, 溢出即停止生成。
下载: 导出CSV
表 3 5种方法在60组有限样本下的评价结果
Table 3. Evaluation of five methods on 60 finite-sample datasets
方法 有效组数 中位数
/周期90%分位数
/周期10−6处低于
参照/组周期分解 60/60 1.131 2.463 41/60 直接BM-GEV 60/60 1.853 3.748 47/60 POT-GPD 60/60 2.824 78.525 15/60 RESTK 60/60 2.736 6.408 28/60 阈值筛选-Gumbel 60/60 11.951 15.486 0/60
下载: 导出CSV
表 4 超限概率分配、样本量和块大小的灵敏度分析
Table 4. Sensitivity to probability allocation, sample size and block size
因素 设置 曲线距离中位数/周期 取值范围/周期 概率分配ρ 0.2 1.745 1.102~7.680 0.5 1.446 0.593~4.885 1.0 1.668 0.391~3.387 样本量 5×10⁴ 1.644 0.699~6.122 105 1.446 0.593~4.885 2×10⁵ 1.157 0.614~5.129 块大小 50 4.780 0.713~26.370 100 1.446 0.593~4.885 200 1.780 0.543~6.170
下载: 导出CSV
表 5 各配置经验参照的逐点95%任务响应时间区间(ms)
Table 5. Pointwise 95% reference intervals of task response time (ms)
配置 10−4 10−5 10−6 1 [738.695, 738.987] [865.010, 865.711] [990.504, 992.431] 2 [717.261, 735.656] [859.000, 863.119] [966.516, 989.164] 3 [717.694, 720.015] [841.785, 861.972] [966.745, 990.351] 4 [739.650, 740.043] [866.104, 868.908] [992.705, 1016.684 ]5 [761.867, 763.242] [890.653, 892.670] [ 1017.830 ,1042.941 ]6 [766.930, 767.912] [916.260, 937.448] [ 1064.326 ,1112.614 ]
下载: 导出CSV
-
[1] 高煜, 肖俏, 王超峰. 时变水声信道下基于多智能体强化学习的水声网络跨层传输调度方法[J]. 水下无人系统学报, 2025, 33(2): 261-271. doi: 10.11993/j.issn.2096-3920.2025-0015Gao Y, Xiao Q, Wang C F. Cross-layer transmission scheduling method for underwater acoustic networks based on multi-agent reinforcement learning under time-varying underwater acoustic channels[J]. Journal of Unmanned Undersea Systems, 2025, 33(2): 261-271. doi: 10.11993/j.issn.2096-3920.2025-0015 [2] Bai W G, Wang H Y, Shen X H, et al. Minimum delay multipath routing based on TDMA for underwater acoustic sensor network[J]. International Journal of Distributed Sensor Networks, 2016, 12(2): 1394340. doi: 10.1155/2016/1394340 [3] Lu Y, Nolte T, Bate I, et al. A statistical response-time analysis of real-time embedded systems[C]//2012 IEEE 33rd Real-Time Systems Symposium, 2012: 351-362. [4] Liu M, Behnam M, Nolte T. An EVT-based worst-case response time analysis of complex real-time systems[C]//IEEE International Symposium on Industrial Embedded Systems, 2013: 249-258. [5] Mostafavi S S, Dán G, Gross J. Data-driven end-to-end delay violation probability prediction with extreme value mixture models[C]//The Sixth ACM/IEEE Symposium on Edge Computing, 2021: 416-422. [6] Vilardell S, Serra I, Mezzetti E, et al. Using Markov's inequality with power-of-k function for probabilistic WCET estimation[C]//34th Euromicro Conference on Real-Time Systems, 2022, 231: 20: 1-20: 24. [7] Griffin D, Burns A. Realism in statistical analysis of worst case execution times[C]//10th International Workshop on Worst-Case Execution Time Analysis, 2010, 15: 44-53. [8] Hitz A S, Davis R A, Samorodnitsky G. Discrete extremes[J]. Journal of Data Science, 2024, 22(4): 524-536. [9] Lu Y C, Cheng L, Wu J B, et al. Task-oriented adaptive dive tracking control for autonomous underwater vehicle with system uncertainties and disturbances[J]. Ocean Engineering, 2025, 331: 121243. doi: 10.1016/j.oceaneng.2025.121243 [10] Gribova V V, Shalfeeva E A, Filaretov V F, et al. The method of intelligent mission planning for autonomous underwater vehicles[J]. Informatics and Automation, 2025, 24(5): 1257-1283. doi: 10.15622/ia.24.5.1 [11] 曹迟, 史文涛, 王百合, 等. 无人水下航行器反潜作战模型仿真[J]. 水下无人系统学报, 2025, 33(1): 156-163. doi: 10.11993/j.issn.2096-3920.2024-0116Cao C, Shi W T, Wang B H, et al. Simulation of anti-submarine warfare model of unmanned undersea vehicles[J]. Journal of Unmanned Undersea Systems, 2025, 33(1): 156-163. doi: 10.11993/j.issn.2096-3920.2024-0116 [12] ARINC653P1-6 Avionics Application Software Standard Interface, Part 1, Required Services[S]. [13] AS6802A Time-Triggered Ethernet[S]. [14] Coles S. An introduction to statistical modeling of extreme values[M]. London: Springer, 2001. -

 下载:

 点击查看大图
计量
- 文章访问数: 3
- HTML全文浏览量: 0
- PDF下载量: 0
- 被引次数: 0